Australia
The Australian economy enters an election campaign in a relatively vulnerable position, with growth slowing, household debt levels high and considerable uncertainty regarding the outlook for housing and, in turn, consumer spending. Not everything is negative, as evidenced by the low unemployment rate, strong exports, and improving business investment. Despite zero growth in the March quarter CPI, the RBA opted to hold the cash rate at 1.50%, possibly preferring to remain on the sidelines during the election campaign. However, while the RBA acknowledged that the household sector is struggling, it still expects disposable income to lift on the back of a robust labour market.
On the property front, housing finance is down almost 20% over the year, dwelling approvals are consistent with a 10–15% decline in residential construction over the next one to two years, and in Melbourne and Sydney prices are down 11–13% from peak levels. The household debt-to-income ratio sits at a record 1.9 times, although with mortgage rates low, the debt service ratio appears manageable for now. In any case, hours worked have grown more than 2.0% over the year and combined with wages growth of around 2.3% suggests growth in household income of more than 4.0% in nominal terms. While not strong by historical standards, it is slightly above the average of the past five years.
Employment growth picked up in March with 25,700 jobs added compared to February’s growth of 4,600. Pleasingly, there was a solid jump in full-time jobs growth, with 48,300 positions added, while part-time positions dropped by 22,600. The unemployment rate increased 0.1 points to 5.0% as the labour force expanded with a rise in the participation rate of 0.1 points to 65.7%.
The AIG Manufacturing Index rose 3.8 points to 54.8, reversing the downward trend over recent months. The sector is still impacted by high energy prices, rising input costs and tighter credit conditions. Australia’s balance on goods and services narrowed from a surplus of $5,140 million in February to $4,949 million in March
Global
With the Fed now on hold and growth slowing back to a more sustainable pace there is an increased likelihood that this expansion can continue. The current economic expansion is now 118 months old and will reach the post-war record of 120 months mid-year. The absence of productivity growth in excess of 2.0% will place more pressure on wages growth, potentially pressuring the Fed to further delay tightening.
While there is no sign of inflation at present, the labour market appears tight, with unemployment at 3.6% following a 263,000 gain in non-farm payrolls in April. However, underemployment is still around 7.3% and the participation rate has the potential to rise from current low levels and provide a further source of labour. The Fed is concerned about the risk of falling into a spiral of permanently low inflation expectations (like Japan), making it increasingly difficult to operate a flexible monetary policy.
In Europe, the manufacturing sector continues to contract, with conditions in Germany deteriorating the most. If there was any good news from April’s data it came from Greece’s manufacturing economy, which enjoyed its strongest improvement in nearly 19 years. However, price growth in the eurozone remains weak with headline CPI falling to 1.4% over the year to March.
Brexit was scheduled for 29 March but has since been postponed to 31 October as Prime Minister May attempts to build a bipartisan deal that can meet the approval of the British parliament and EU negotiators. An interesting complication arises with the UK obligated to participate in the elections for the EU parliament on 23 May.
The Chinese economy seems to be responding to the stimulus put in place over the past 12 months. The first quarter GDP growth rate recorded 6.4%, in line with the previous quarter and beating expectations in the process. The services sector remains solid, while March industrial production data comfortably beat projections with growth of 8.5% year-on-year, which is the fastest pace in more than four years. Growth in new loans and a lift in bond issuance to support infrastructure spending have been the drivers of growth, while other shadow banking activities have continued to dwindle
Commodities
Oil settled higher in April as US inventories were unexpectedly lower and growing tensions between the US and Iran, along with ongoing trade tensions, drove prices higher. Metals were down in April and Gold was mostly flat.
Australian Shares
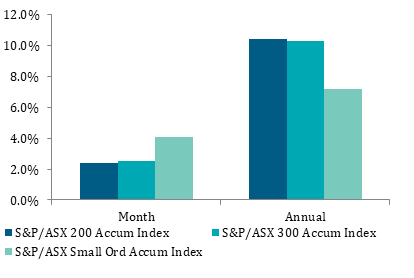
The S&P/ASX 200 Index returned 2.4% in April, rising above 6,300 points, but appeared to find some resistance in early May as it attempted to push past its previous August 2018 high. Performance was led by the Consumer Staples sector and the Information Technology sector which extended its gains and remains the fastest
growing sector over the past 12 months. Australian equities are fully recovered from the December quarter downturn but the outlook remains uncertain. The slowdown in the housing market is expected to continue in the near term and remain a source of headwinds for Australian equities.
International Shares
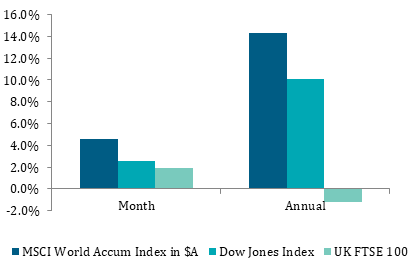
Global shares extended their gains over April with the MSCI World Ex-Australia Index rising 4.3%, led by the ongoing recovery in developed market equities. Improving investor sentiment has led to renewed interest in emerging markets, although the benchmark is still suffering from large falls through 2018 and has been essentially flat in Australian dollar terms over the last 12 months. With valuations looking increasingly stretched and lingering concerns prevailing, global equities are expected to remain volatile in the near term.
Property
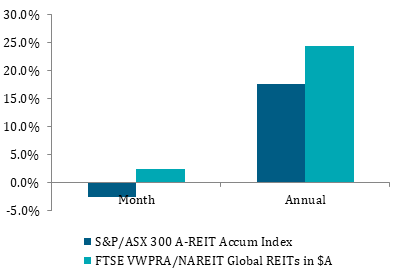
Australian listed property had a weak April, returning -2.6% and suffering from a general rise in yields. After strong performance across all sectors in March, retail was the major drag in April. With retail assets representing almost 46% of the S&P/ASX 300 A-REIT Index, the underperformance of this sector is more pronounced. Globally, developed market REITs fell 1.0% in Australian dollar hedged terms.
Fixed Interest
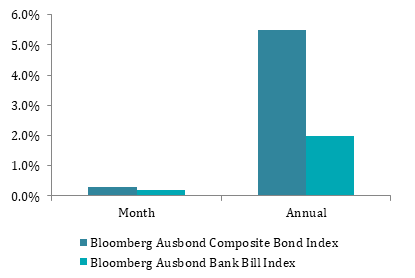
The RBA has maintained its cautious stance on monetary policy, holding the cash rate steady at 1.50% at its May meeting. The recent inversion of the US yield curve has raised the spectre of a possible recession. While investors debate the timing and severity of any future recession, at the very least markets expect that the Fed is more likely to cut rates rather than hike again in the short term.
Australian Dollar
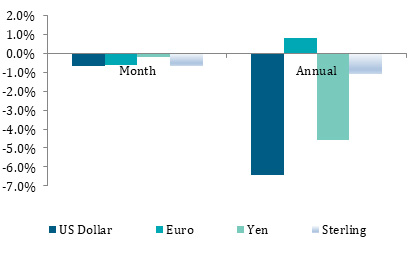
The Australian dollar continues to tread water and is likely to trade in a fairly tight range over the next few months as markets wait for the RBA to make a clear decision on the direction of interest rates. Meanwhile the dollar is being buffeted by conflicting signals: low and declining domestic interest rates and spreads point to downside in the currency, while an improving Chinese economy and higher commodity prices point to upside. The Australian dollar was flat in trade-weighted terms in April, softening only slightly against major currencies. Over the three months to the end of April 2019 the Australian dollar depreciated 1.8% in trade-weighted terms.
Key Investment Indices
| As at 30 April 2019 | 1 month | 3 months | 6 months | 1 yr | 5 yrs | |
| Australian Shares | % | % | % | % | % | |
| S&P/ASX 200 Accumulation Index | 2.4 | 9.3 | 10.9 | 10.4 | 7.5 | |
| S&P/ASX 300 Accumulation Index | 2.5 | 9.4 | 10.9 | 10.3 | 7.6 | |
| S&P/ASX Small Ordinaries Accumulation Index | 4.1 | 11.0 | 11.9 | 7.2 | 9.1 | |
| S&P/ASX 300 Industrials Index | 3.8 | 10.2 | 10.3 | 9.7 | 7.9 | |
| S&P/ASX 300 Resources Index | -2.5 | 6.9 | 13.5 | 13.1 | 5.6 | |
| International Shares | Value | % | % | % | % | % |
| MSCI World Accumulation Index in $A | 4.6 | 12.0 | 9.6 | 14.3 | 13.6 | |
| MSCI World Accumulation Index ($A hedged) | 3.9 | 9.2 | 8.5 | 8.4 | 10.3 | |
| MSCI Emerging Markets Index in $A | 3.1 | 6.9 | 14.6 | 1.8 | 9.9 | |
| Dow Jones Index in $US | 26,593 | 2.6 | 6.4 | 5.9 | 10.1 | 9.9 |
| S&P 500 Index in $US | 2,946 | 3.9 | 8.9 | 8.6 | 11.3 | 9.4 |
| FTSE 100 Index in £ | 7,418 | 1.9 | 6.5 | 4.1 | -1.2 | 1.8 |
| Nikkei 225 Index in ¥ | 22,259 | 5.0 | 7.2 | 1.5 | -0.9 | 9.3 |
| Deutsche Boerse Index in € | 12,344 | 7.1 | 10.5 | 7.8 | -2.1 | 5.2 |
| Hang Seng Index in HKD | 29,699 | 2.2 | 6.3 | 18.9 | -3.6 | 6.1 |
| Shanghai Shenzhen CSI 300 Index in RMB | 3,913 |
1.1 |
22.2 |
24.1 | 4.2 | 12.6 |
| Property | % | % | % | % | % | |
| S&P/ASX 200 A-REIT Accumulation Index | -2.6 | 5.3 | 13.2 | 17.7 | 12.9 | |
| S&P/ASX 300 A-REIT Accumulation Index | -2.3 | 5.5 | 13.4 | 18.0 | 13.1 | |
| FTSE EPRA/NAREIT Global REITs in $A | 0.5 | 6.2 | 11.2 | 19.8 | 11.6 | |
| Fixed Interest | % | % | % | % | % | |
| Bloomberg Ausbond Bank Bill Index | 0.2 | 0.5 | 1.0 | 2.0 | 2.1 | |
| Bloomberg Ausbond Composite Bond Index | 0.3 | 3.1 | 5.5 | 7.9 | 4.9 | |
| Barclays Global Aggregate Index ($A Hedged) | 0.0 | 1.8 | 4.7 | 5.0 | 4.7 | |
| Inflation | % | % | % | % | % | |
| Australia CPI | 0.1 | 0.1 | 0.5 | 1.3 | 1.6 | |
| Currencies (relative to $A) | Value | % | % | % | % | % |
| $US | 0.7048 | -0.7 | -3.1 | -0.4 | -6.4 | -5.4 |
| Japanese ¥ | 78.5510 | -0.2 | -0.8 | -1.7 | -4.6 | -3.7 |
| Euro € | 0.6286 | -0.6 | -1.1 | 0.5 | 0.8 | -1.3 |
| Sterling £ | 0.5409 | -0.7 | -2.5 | -2.4 | -1.1 | -0.4 |
| Chinese Yuan | -0.7 | -3.1 | -4.2 | -1.0 | -4.1 | |
| Commodities | Value | % | % | % | % | % |
| S&P Goldman Sachs Commodity Index ($US) | 2.8 | 9.5 | -2.2 | -6.2 | -7.3 | |
| Oil ($US/barrel) | 72.8 | 6.3 | 18-8 | -2.1 | -6.8 | -8.5 |
| Gold ($US/ounce) | 1,283.53 | -0.7 | -2.9 | 5.7 | -2.4 | -0.1 |
| Iron Ore ($US/tonne) | 93.79 |
Sources: Lonsec, Atchison Consulting, Colonial First State