Australia
The big news in Australia is the RBA’s switch to rate cutting mode, with two cuts to the cash rate over June and July to a record low 1.00%. The minutes of the June meeting point to concern about the US-China trade dispute, while domestically the decline in dwelling investment has had an impact on economic growth and households remain constrained by low wages growth and falls in home prices. The prospect of sub-1.0% cash rates has further undermined the Australian dollar and driven investors towards higher yielding financial assets.
Jobs growth has been robust over the financial year, with 4.3 million full-time jobs and 8.9 million part-time jobs added to the end of May. However, a slow but steady rise in the participation rate has meant that there may still be some spare capacity in the labour market, resulting a rise in the unemployment rate from 5.1% to 5.2%.
The AIG Manufacturing Index fell 3.3 points in June to 49.4, dropping below the critical 50.0 level that indicates expansion. Manufacturers pointed to ongoing drought conditions detracting from equipment sales and slowing activity in residential construction.
The Westpac Melbourne Institute Index of Consumer Sentiment fell to 96.5 in July, moving below the 100 level and indicating that pessimists now outnumber optimists, even as interest rates fall and the government’s tax cuts are legislated. Not even a pause in trade hostilities and signs that the property market may be stabilising were enough to lift consumers’ spirits. The survey noted that increasing concern about the economy is undermining consumers’ sense of job security, with confidence in the labour market deteriorating sharply in July.
Australia’s balance on goods and services showed the trade surplus rise from a seasonally adjusted $4,820 million to a record high $5,745 million, supported by higher metals prices and softness in the Australian dollar.
Global
The G20 summit in late June brought some peace to trade tensions as Xi and Trump agreed to restart talks, but the issue has clearly undermined confidence and expectations of a recovery in growth in the second half of 2019. The US has already placed tariffs on US$250 billion worth of Chinese products and has threatened tariffs on $325 billion more, while China in turn has set tariffs on $110 billion worth of US goods and is threatening additional measures that would affect US businesses in China.
US inflation and wages growth readings have been subdued, with core CPI dropping back to 2.0%, the core PCE price index rising just 1.6%, and wages growth easing back to 3.1%.
The good news was the surprise June payrolls data, which showed 224,000 jobs added over the month, with markets suspecting that May’s disappointing result may have been a one-off. As broadly expected, the Fed left the funds rate on hold at its June FOMC meeting, but hinted at rate cuts in the near future.
Inflation in the eurozone was 1.2% year-on-year in June, steady on May and down on April’s result of 1.7%. Core inflation rose from 0.8% to 1.1% but remains obdurately low.
The Chinese economy remains soft by historical standards and exposed to the escalating trade war and weaker global trade growth. Industrial activity is very subdued despite the range of stimulus measures undertaken over the past year.
The G20 Summit proved to be a pressure valve for the trade tensions that had rocked markets in May, with both leaders agreeing to return to the negotiating table. President Trump’s decision to ease restrictions on Chinese carrier Huawei may indicate a willingness to reach a deal, although the issue remains live for markets.
Together with an economy already struggling to maintain momentum, the trade issue has prompted further stimulus from Chinese authorities, who say they will adjust financing rules to allow local authorities to step up infrastructure spending. The move goes against the policy of recent years aimed at reducing financial stability risks by reigning in the growth of credit used to finance inefficient infrastructure projects.
Commodities
A pause in trade tensions saw the oil rally resume in June, while the decision by OPEC allies to extend production cuts through to March 2020 is expected to support oil prices. Metals also saw a bounce, with gains in Lead, Nickel, Copper, Tin and Aluminium. Gold rose 8.0% to $1,409.55.
Australian Shares
Australian shares pushed higher through June on the back of improving sentiment around global trade and a rallying US market.
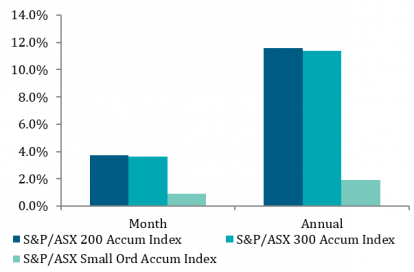
The S&P/ASX 200 Index returned 3.7% over the month, finishing above 6,600 points and moving above 6,750 early in July, pushing closer to its 2007 record high. Gains were led by large cap shares, with miners capturing the spotlight.
International Shares
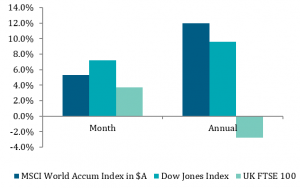
Global shares rebounded in June as central banks prepared markets for potential rate cuts and trade tensions appeared to ease following the G20 summit in late June.
Developed market shares, measured by theMSCI World Ex Australia Index, rose 5.4% in Australian dollar terms and emerging market shares rose 5.0%, helped by a softer US currency. The US S&P 500 Index rose 7.1% in June in US dollar terms with all sectors positive. In Europe, the resources sector was the top gainer among STOXX Europe 600 shares. Asian markets were higher in June as trade fears lifted (at least for now).
Property
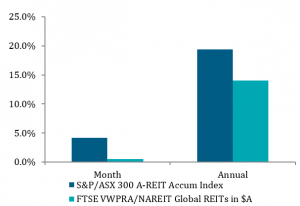
Australian listed property continued its winning streak in June, returning 4.2% as yields fell and the RBA’s rate cut spurred interest in income-generating assets, including listed property. Dragging on the index were the shopping centre REITs, which remain affected by the soft retail environment.
Fixed Interest
With bond yields at record lows in many developed markets, the rally in bonds was given a further boost by the RBA, which cut rates to 1.00% at its July meeting.
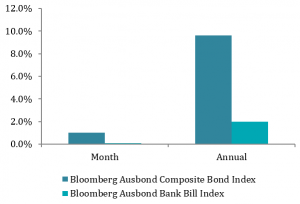
Australian bonds, measured by the AusBond Composite Index, returned 1.0% over June and has returned an impressive 9.6% over the past 12 months. The yield on Australian 10-year Treasuries fell over June to 1.32%, and the 90-day Bill rate fell to 1.21%. The story is much the same globally: while the Fed is yet to cut rates, over the course of 2019 they have pivoted away from a tightening to an easing bias.
Australian Dollar
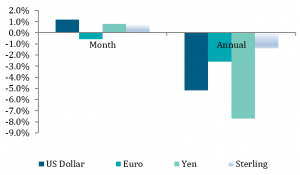
The prospect of sub-1.0% cash rates has further undermined the Australian dollar. The Australian dollar was steady in June in trade weighted terms, moving higher against the US dollar, British pound and Japanese yen and falling against the euro.
Over the three months to the end of June 2019 the Australian dollar has fallen 0.2% in trade- weighted terms.
Key Investment Indices
| As at 30 June 2019 | 1 month | 3 months | 6 months | 1 yr | 5 yrs | |
| Australian Shares | % | % | % | % | % | |
| S&P/ASX 200 Accumulation Index | 3.7 | 8.0 | 19.7 | 11.6 | 8.9 | |
| S&P/ASX 300 Accumulation Index | 3.6 | 8.1 | 19.8 | 11.4 | 8.9 | |
| S&P/ASX Small Ordinaries Accumulation Index | 0.9 | 3.6 | 16.8 | 1.9 | 9.3 | |
| S&P/ASX 300 Industrials Index | 3.0 | 8.9 | 18.6 | 10.5 | 9.0 | |
| S&P/ASX 300 Resources Index | 6.3 | 5.0 | 24.8 | 15 | 7.9 | |
| International Shares | Value | % | % | % | % | % |
| MSCI World Accumulation Index in $A | 5.3 | 5.2 | 17.3 | 12.0 | 13.3 | |
| MSCI World Accumulation Index ($A hedged) | 5.9 | 3.4 | 16.4 | 6.2 | 9.3 | |
| MSCI Emerging Markets Index in $A | 4.9 | 1.8 | 11.0 | 6.6 | 8.8 | |
| Dow Jones Index in $US | 7.2 | 2.6 | 14.0 | 9.6 | 9.6 | |
| S&P 500 Index in $US | 6.9 | 3.8 | 17.4 | 8.2 | 8.5 | |
| FTSE 100 Index in £ | 3.7 | 2.0 | 10.4 | -2.8 | 1.9 | |
| Nikkei 225 Index in ¥ | 5.7 | 7.6 | 17.4 | 0.7 | 4.6 | |
| Deutsche Boerse Index in € | 3.3 | 0.3 | 6.3 | -4.6 | 7.0 | |
| Hang Seng Index in HKD | 6.1 | -1.8 | 10.4 | -1.4 | 4.2 | |
| Shanghai Shenzhen CSI 300 Index in RMB | 5.4 | -1.2 | 27.1 | 9.0 | 12.1 | |
| Property | % | % | % | % | % | |
| S&P/ASX 200 A-REIT Accumulation Index | 4.2 | 4.1 | 19.4 | 19.3 | 13.6 | |
| S&P/ASX 300 A-REIT Accumulation Index | 4.2 | 4.1 | 19.1 | 19.4 | 13.8 | |
| FTSE EPRA/NAREIT Global REITs in $A | 0.5 | 2.2 | 15.8 | 14.0 | 11.5 | |
| Fixed Interest | % | % | % | % | % | |
| Bloomberg Ausbond Bank Bill Index | 0.1 | 0.5 | 1.0 | 2.0 | 2.1 | |
| Bloomberg Ausbond Composite Bond Index | 1.0 | 3.1 | 6.6 | 9.6 | 5.1 | |
| Barclays Global Aggregate Index ($A Hedged) | 1.3 | 2.7 | 5.6 | 7.2 | 4.9 | |
| Inflation | % | % | % | % | % | |
| Australia CPI | 0.1 | 0.3 | 0.3 | 1.3 | 1.6 | |
| Currencies (relative to $A) | Value | % | % | % | % | % |
| $US | 0.7020 | 1.2 | -1.1 | -0.4 | -5.2 | -5.7 |
| Japanese ¥ | 75.7050 | 0.8 | -3.8 | -2.1 | -7.7 | -4.6 |
| Euro € | 0.6172 | -0.6 | -2.4 | 0.4 | -2.6 | -2.2 |
| Sterling £ | 0.5530 | 0.7 | 1.6 | 0.1 | -1.4 | -0.1 |
| Chinese Yuan | 0.8 | 1.0 | -0.3 | -1.6 | -4.0 | |
| Commodities | Value | % | % | % | % | % |
| S&P Goldman Sachs Commodity Index ($US) | 4.3 | -2.0 | 13.6 | -12.7 | -8.4 | |
| Oil ($US/barrel) | 66.55 | 9.3 | -2.8 | 28.8 | -21.2 | -11.1 |
| Gold ($US/ounce) | 1,409.55 | 8.0 | 9.1 | 9.9 | 12.5 | 1.2 |
| Iron Ore ($US/tonne) | 112.90 |
Sources: Lonsec, Atchison Consulting