Australia
Market expectations for a cut in interest rates were satisfied in June as the RBA decided to lower the cash rate by 25 basis points to a record low 1.25%. The outlook remains broadly unchanged with the Australian economy expected to grow by 2.75% in both 2019 and 2020, but the RBA noted its intention is to provide additional support to the labour market and ensure that inflation expectations can be sustained. The move follows the very low inflation reading for the March quarter, which pointed to a significant downshift in growth over the second half of 2018, driven by falls in. dwelling approvals and weakness in household spending, which has not been reflected in labour market indicators.
While jobs growth has been robust, with a further 28,400 jobs added in April, a rise in the participation rate has seen the unemployment rate rise to 5.2%. The unemployment rate in NSW has risen from 3.9% to 4.5% in the space of four months, while in Victoria it has risen from a low of 4.2% in December to 4.9%. While these monthly readings can be volatile, the trend is difficult to ignore in the major eastern states.
The AIG Manufacturing Index fell 2.1 points in May to 52.7, remaining in expansion but growing at a slower rate. Respondents reported lower demand during the month, while higher electricity costs are still impacting the industry, especially the metals and machinery & equipment sectors.
Australia’s balance on goods and services showed a trade surplus of a seasonally adjusted $4,871 million in April, narrowing slightly on the previous month but still holding up near record highs due to a strong commodities market, including rises in iron ore prices due to supply problems in Brazil and weaker Chinese output.
Global
The breakdown in trade negotiations between the US and China has rattled markets, while the growing threat of protectionism has dampened the economic outlook. Central banks have dispensed with further tightening, but markets clearly see a case for easing given the current geopolitical risks, low inflation, and the fear of an economic downturn.
The US economy seems to have settled back towards a more sustainable growth path. The US is on track to record its longest post-war economic expansion come June when it matches the 120-month expansion of the 1990s. Interestingly, the growth rate across this expansion has been just 2.3% per annum, well below that of previous expansions, including the 3.6% per annum rate recorded in the 1990s.
Europe is battling low inflation and falls in manufacturing activity, with some small signs of improvement overshadowed by trade fears and a tense Europe-wide election. The eurozone grew 0.4% in the March quarter and the European Commission forecasts German GDP to grow by 0.5% through 2019, lower than the 1.4% expected for France and the 1.2% expected for the euro area. It has been suggested that a move to a more expansionary fiscal policy in the three major economies in the zone, together with a pickup in Chinese growth, could boost GDP growth a full percentage point by the end of 2019.
In China, recent economic data has broadly undershot expectations, with the May manufacturing PMI slipping from 50.1 to 49.4 (lower than the expected 50.0) and April industrial production easing to 5.4% after spiking to 8.5% in March. Meanwhile retail sales for April slowed from 8.7% to 7.2% and investment spending also slowed slightly from 6.3% to 6.1%. The major news is the escalation in the trade war with the US, with the Trump administration accusing the Chinese of backing away from earlier agreed positions, creating a case for further hikes in duties from 10% to 25% on US $200 billion of Chinese imports, accompanied with the threat to extend tariffs to another US $300 billion of goods.
China subsequently responded, saying it would levy duties on US $60 billion of goods. The Chinese economy appeared to be responding to stimulus measures put in place over the past year, with March quarter GDP growth of 6.4%, which was in line with the previous quarter and above expectations. However, recent data points to a weaker situation, raising concerns that current levels of stimulus may not be enough, especially if the trade dispute is not resolved. The authorities have one eye fixed on financial stability and one on achieving a minimum growth rate of around 6.0%.
Commodities
Oil experienced an end to recent bullishness in May as rising geopolitical uncertainty and a deceleration in demand for crude put pressure on prices. The Brent spot price fell 1.7% to US $66.78/b. Metals continued to drop, with falls in Zinc, Copper, Lead, Tin, Nickel and Aluminium. Gold rose 2.1% to US $1,305.58/oz, surging higher in the early part of June and breaking away from its year-to-date lows as talk of Mexican tariffs spurred further buying.
Australian Shares
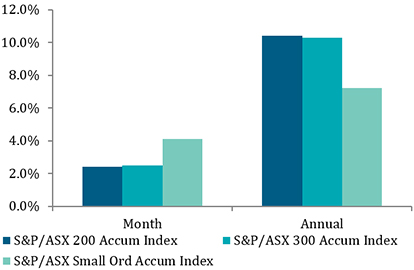
The S&P/ASX 200 Index returned 1.7% in May, with the price index rising above 6,500 points to end the month at just under 6,400 as global pressures, including the re-emerging US-China trade dispute, added to uncertainty over the month.
Despite the weakness, Australian large cap shares held up well compared to global indices, with the top 50 stocks rising 2.6%.
International Shares
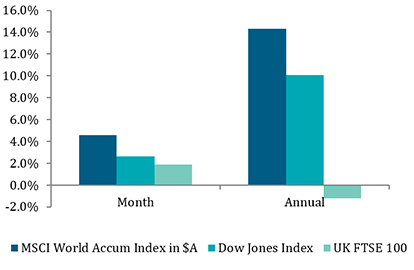
Global shares retreated in May as the re-emergence of trade fears and the adjustment of market expectations with respect to rate cuts dampened the outlook. Developed market shares, measured by the MSCI World Ex Australia Index, lost 4.3% in Australian dollar terms while emerging market shares fell 5.7%, buffeted by a rise in the US dollar.
Europe was unable to avoid the pain, with the broad STOXX Europe 600 Index falling 5.3%. Meanwhile the sharp fall in yields has put pressure on Europe’s major banks, forcing some to multi-year lows. Asian markets were also hit by trade fears.
Property
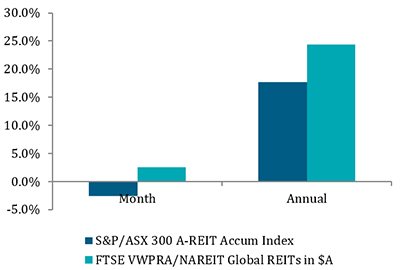
Australian listed property had a positive month in May, returning 2.5% as a drop in fixed income yields drove prices higher in what tends to be a rate-sensitive sector. Shopping centres continue to struggle in the face of softer retail activity and a cautious household sector.
While Labor’s negative gearing proposals were thought to favour developers by limiting tax concessions to new stock, the improvement in sentiment has so far had a greater impact on the sector.
Fixed Interest
The bond market is still expecting the Fed to ease policy through to 2020, while the US administration is showing it is prepared to keep the trade dispute with China running. While recent Fed comments suggest an extended period of steady rates, markets clearly see a rolling trade dispute as a key factor in favour of additional monetary support.
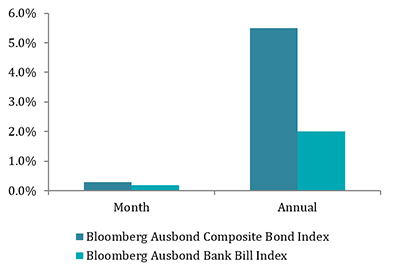
The fall in yields led to positive performance from bond indices, with the Bloomberg Barclays Global Aggregate Index (AUD Hedged) returning 1.4%. Markets remain spooked by the inverted US yield curve, which is a potential indicator of recession.
Australian Dollar
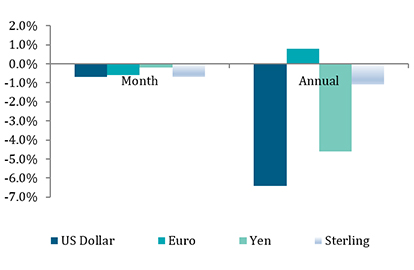
The Australian dollar appeared to benefit from a surprise Coalition election victory with some unwinding of pessimism around the housing market, but a rising US dollar and expectations of an RBA rate cut pulled the currency in the other direction.
The Australian dollar fell against the US dollar, euro and Japanese yen, and rising against the British pound.
Key Investment Indices
| As at 31 May 2019 | 1 month | 3 months | 6 months | 1 yr | 5 yrs | |
| Australian Shares | % | % | % | % | % | |
| S&P/ASX 200 Accumulation Index | 1.7 | 4.8 | 15.3 | 11.1 | 7.7 | |
| S&P/ASX 300 Accumulation Index | 1.7 | 5.0 | 15.4 | 10.9 | 7.8 | |
| S&P/ASX Small Ordinaries Accumulation Index | -1.3 | 2.7 | 10.9 | 2.1 | 8.8 | |
| S&P/ASX 300 Industrials Index | 1.9 | 6.1 | 13.5 | 10.8 | 8.1 | |
| S&P/ASX 300 Resources Index | 1.3 | 0.8 | 23.1 | 11.6 | 6.2 | |
| International Shares | Value | % | % | % | % | % |
| MSCI World Accumulation Index in $A | -4.4 | 1.4 | 6.7 | 8.8 | 12.2 | |
| MSCI World Accumulation Index ($A hedged) | -6.0 | -0.7 | 0.8 | 0.6 | 8.4 | |
| MSCI Emerging Markets Index in $A | -5.8 | -2.0 | 6.8 | -0.3 | 8.0 | |
| Dow Jones Index in $US | 24,815 | -6.7 | -4.3 | -2.8 | 1.6 | 8.2 |
| S&P 500 Index in $US | 2,752 | -6.6 | -1.2 | -0.3 | 1.7 | 7.4 |
| FTSE 100 Index in £ | 7,162 | -3.5 | 1.2 | 2.6 | -6.7 | 0.9 |
| Nikkei 225 Index in ¥ | 20,601 | -7.5 | -3.7 | -7.8 | -7.2 | 7.1 |
| Deutsche Boerse Index in € | 11,727 | -5.0 | 1.8 | 4.2 | -7.0 | 3.4 |
| Hang Seng Index in HKD | 26,901 | -9.4 | -6.1 | 1.5 | -11.7 | 3.1 |
| Shanghai Shenzhen CSI 300 Index in RMB | 3,630 | -7.2 | -1.1 | 14.4 | -4.5 | 11.0 |
| Property | % | % | % | % | % | |
| S&P/ASX 200 A-REIT Accumulation Index | 2.5 | 6.1 | 16.5 | 17.0 | 13.4 | |
| S&P/ASX 300 A-REIT Accumulation Index | 2.3 | 6.0 | 16.3 | 17.2 | 13.6 | |
| FTSE EPRA/NAREIT Global REITs in $A | 1.2 | 4.8 | 12.1 | 18.9 | 11.4 | |
| Fixed Interest | % | % | % | % | % | |
| Bloomberg Ausbond Bank Bill Index | 0.2 | 0.5 | 1.0 | 2.0 | 2.1 | |
| Bloomberg Ausbond Composite Bond Index | 1.7 | 3.9 | 7.1 | 9.0 | 5.0 | |
| Barclays Global Aggregate Index ($A Hedged) | 1.4 | 3.1 | 5.7 | 6.0 | 4.7 | |
| Inflation | % | % | % | % | % | |
| Australia CPI | 0.1 | 0.2 | 0.4 | 1.3 | 1.6 | |
| Currencies (relative to $A) | Value | % | % | % | % | % |
| $US | 0.6938 | -1.56 | -2.2 | -5.0 | -8.3 | -5.7 |
| Japanese ¥ | 75.1240 | -4.4 | -4.9 | -9.5 | -8.8 | -4.5 |
| Euro € | 0.6211 | -1.2 | -0.5 | -3.8 | -4.0 | -1.9 |
| Sterling £ | 0.5493 | 1.6 | 2.7 | -4.1 | -3.5 | -0.2 |
| Chinese Yuan | -2.4 | -3.1 | 0.6 | -7.3 | 2.0 | |
| Commodities | Value | % | % | % | % | % |
| S&P Goldman Sachs Commodity Index ($US) | -8.7 | -4.4 | 0.3 | -15.3 | -8.9 | |
| Oil ($US/barrel) | 64.49 | -16.3 | +6.5 | 5.1 | -20.2 | -12.2 |
| Gold ($US/ounce) | 1,305.58 | 1.7 | -0.6 | 7.0 | 0.5 | 0.9 |
| Iron Ore ($US/tonne) | 97.76 |
Sources: Lonsec, Atchison Consulting